Exposure to Magnetic Fields
Exposure to magnetic fields from electric power sources occurs during daily activities at home, and virtually everywhere we go, including our places of work or school, at retail and business establishments, recreational facilities and hospitals. Sources of exposure include any electrical device (e.g., electric shaver), appliance (e.g., food blender) or piece of equipment (e.g., power tool) during its operation, in addition to building wiring and nearby power lines.
Power Lines
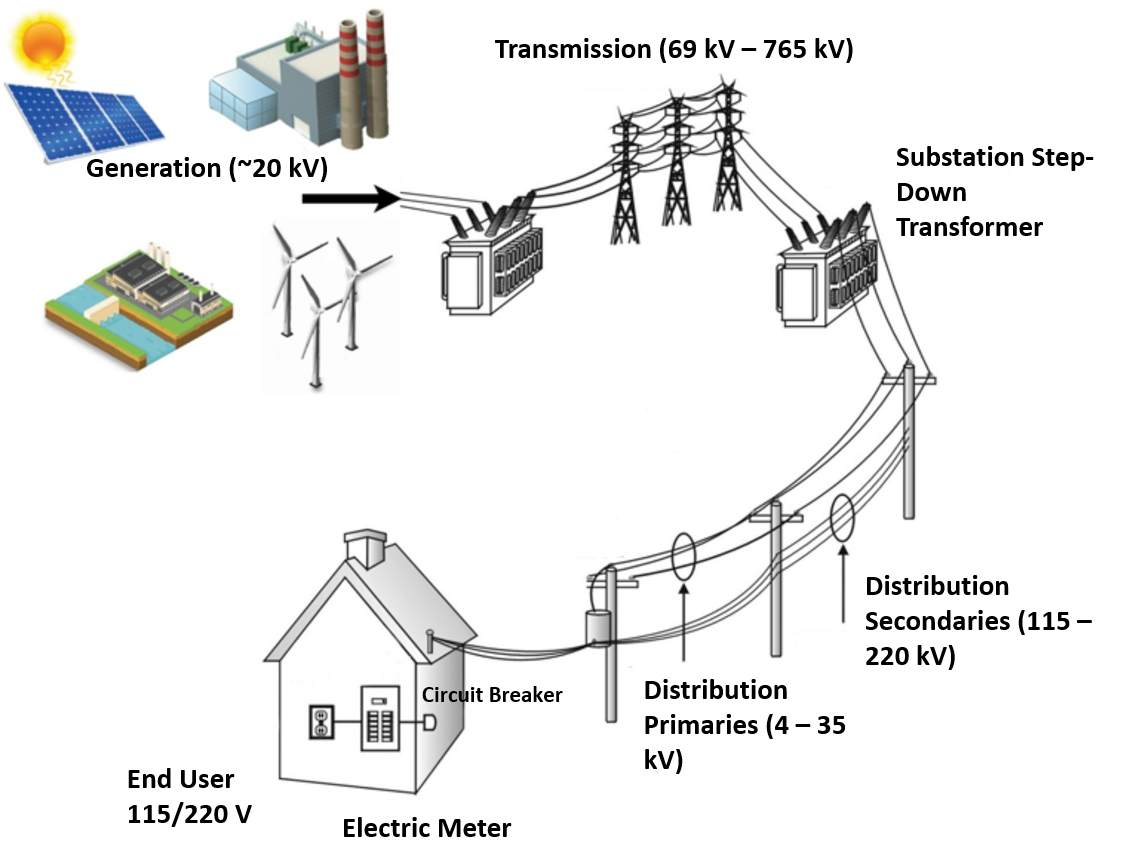
Figure 1 illustrates the route electrical power takes from its origin at a generating station to its end use in our homes. The substation “steps down” the voltage from incoming transmission lines to voltages carried on distribution lines that bring electrical power into our communities for use in our homes. Electricity is transported on transmission lines of varying voltage classifications, line configuration and tower design depending on numerous factors, including the required capacity (the maximum amount of power a line’s design allows), available space on the right-of-way (ROW), state and local requirements, and other factors. In North America, transmission lines are energized at voltages that vary from about 115 kilovolts (kV) to 765 kV (other countries use different standard voltages of about 100 to 400 kV). On the downstream side of the substation, distribution lines may be energized anywhere from 4 kV (older lines) to 35 kV, and are also built with a variety of pole designs (or nowadays, often underground) depending on local conditions and requirements.
There are a few high voltage direct current (HVDC) transmission lines in the world, but HVDC lines operate at zero Hz and therefore have different characteristics than 50/60 Hz alternating current lines.
Some may ask, why do transmission lines have such high voltages? The answer has two facets. First when electrical current flows on a conductor, some of its energy is lost as heat, meaning a portion of its energy never reaches its intended user. Second, electrical power (called watts) carried on a line scales directly with the line’s voltage multiplied by its current. The higher the voltage the less the current required for the same amount of power. Therefore, the voltage is ‘stepped up’ at a transformer at the generation station for long distance transport over transmission lines. Stepping up the voltage lowers the current and far less energy is lost. The voltage is ‘stepped down’ at the local substation transformer such that distribution lines can serve our neighborhoods. The voltage on the distribution system is stepped down again to house voltage (about 115 volts) by a transformer located usually on a nearby pole in the street, or in a metal cabinet on the ground.
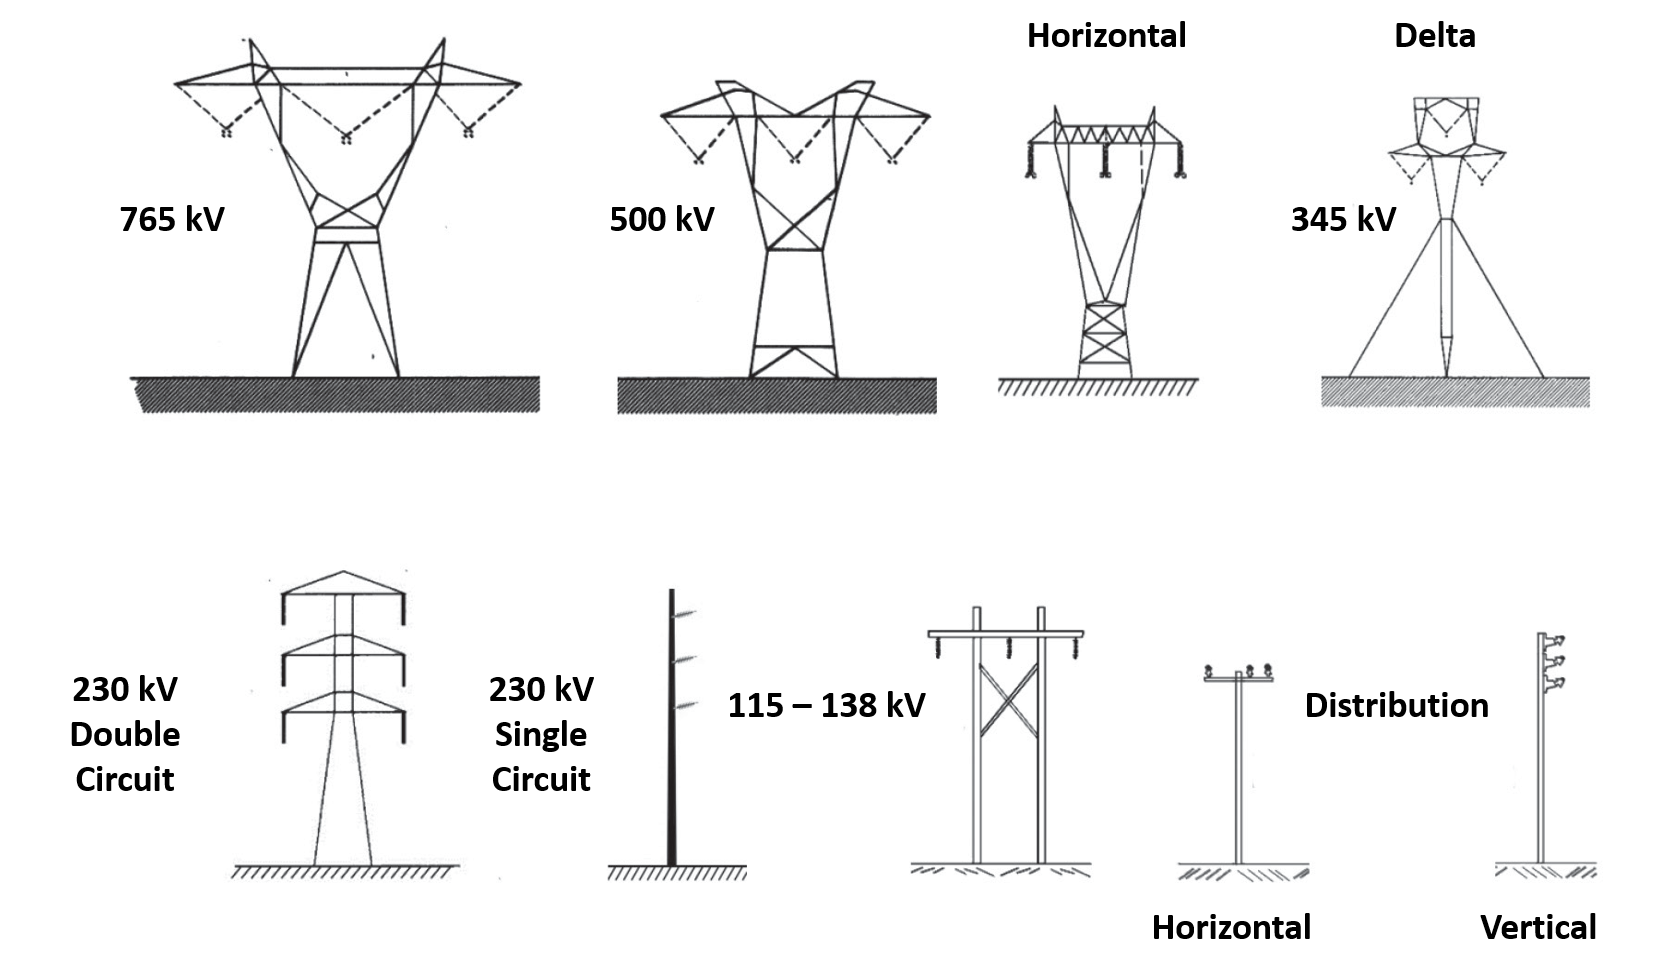
Cross-sections of representative tower and pole configurations used in the U.S. are shown in Figure 2 and depict a variety of line types. (Not shown are “sub-transmission lines” rated between about 40 and 70 kV and underground high voltage transmission lines, which are prevalent in heavily urbanized areas.)
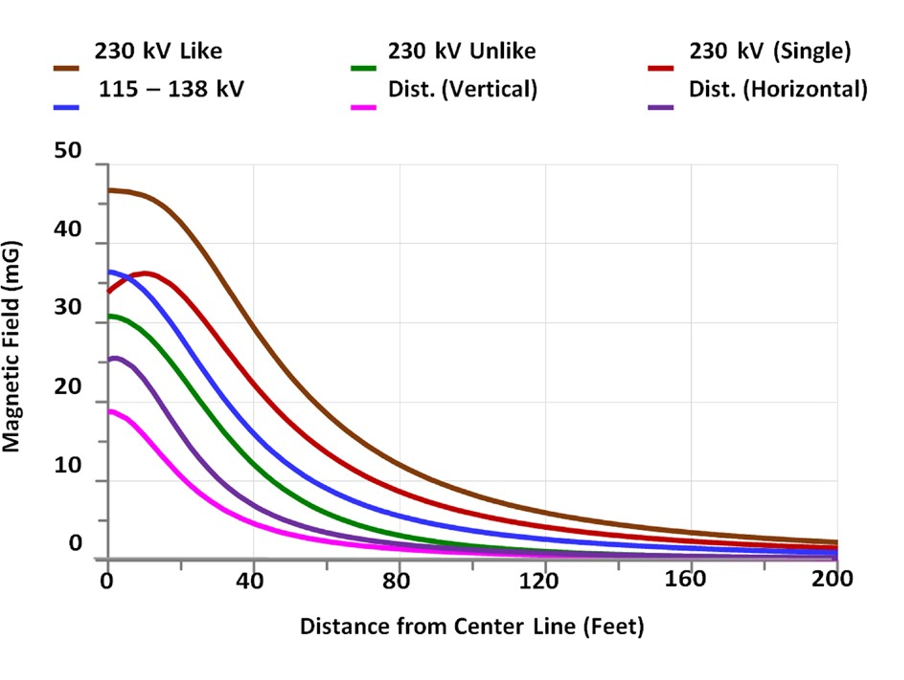
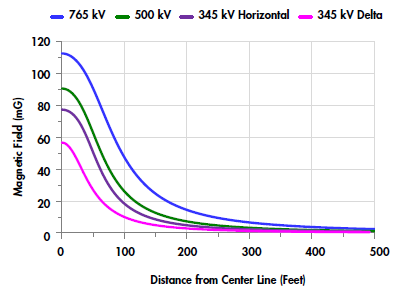
Figure 3 illustrates the magnetic field profiles with distance from the lines that would occur with typical (or greater) current loads for the voltage classifications shown. The fields decrease rapidly with distance away from a power line. For example, if you double the distance away from a starting point the field decreases to only about 25% of the value at the starting point. The specific magnetic field values associated with overhead power lines are highly variable. However, the magnetic field may reach 100 mG directly beneath the center of a 765-kV line, with fields generally decreasing at progressively lower line voltages; up to 30 mG may be found beneath heavily-loaded distribution lines
For underground lines, the general public’s magnetic field exposure level is at its maximum value at walkway or street level directly above the line, with its value depending on load, the depth at which the line is buried, and other design factors. The field may exceed 50-100 mG or more in certain cases, decreasing quickly with distance away. In many cases, the line may be buried beneath a thoroughfare, and exposure from these sources could occur while driving along the road or crossing as a pedestrian.
Typical Levels and Exposures
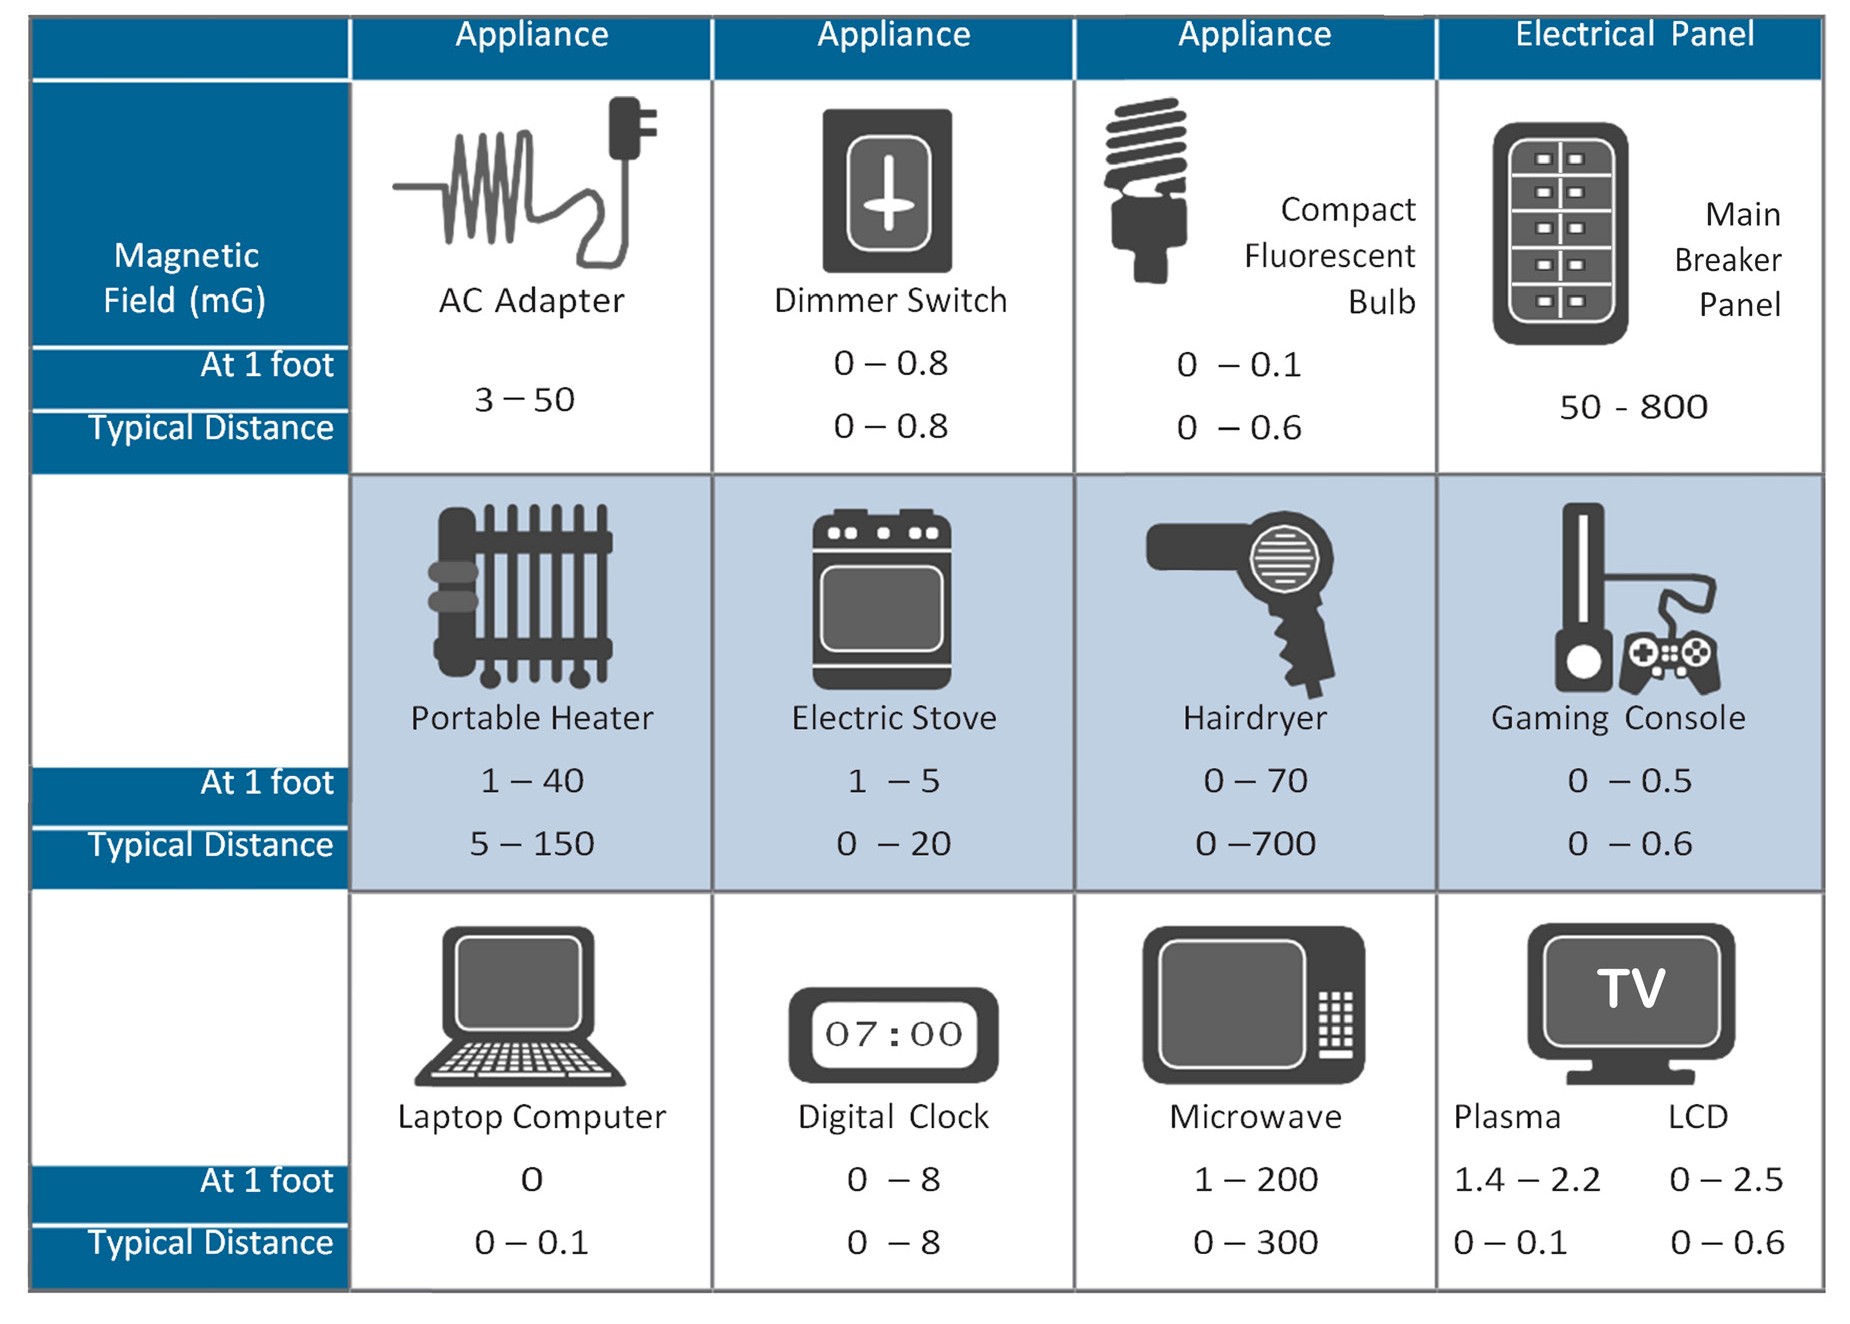
As indicated earlier, a household appliance (and its wiring) produces an electric field whenever it is plugged in, whether operating or not. On the other hand an appliance produces a magnetic field only when it is turned on. Within a few feet of an appliance, both types of fields fall to background levels. As shown in Table 1 , some of the appliances that are used close to the body can produce magnetic fields that are quite high. For example, at the head, the exposure levels from some hairdryers can be as high as 700 mG. Fields from computer monitors and TVs are quite low overall.
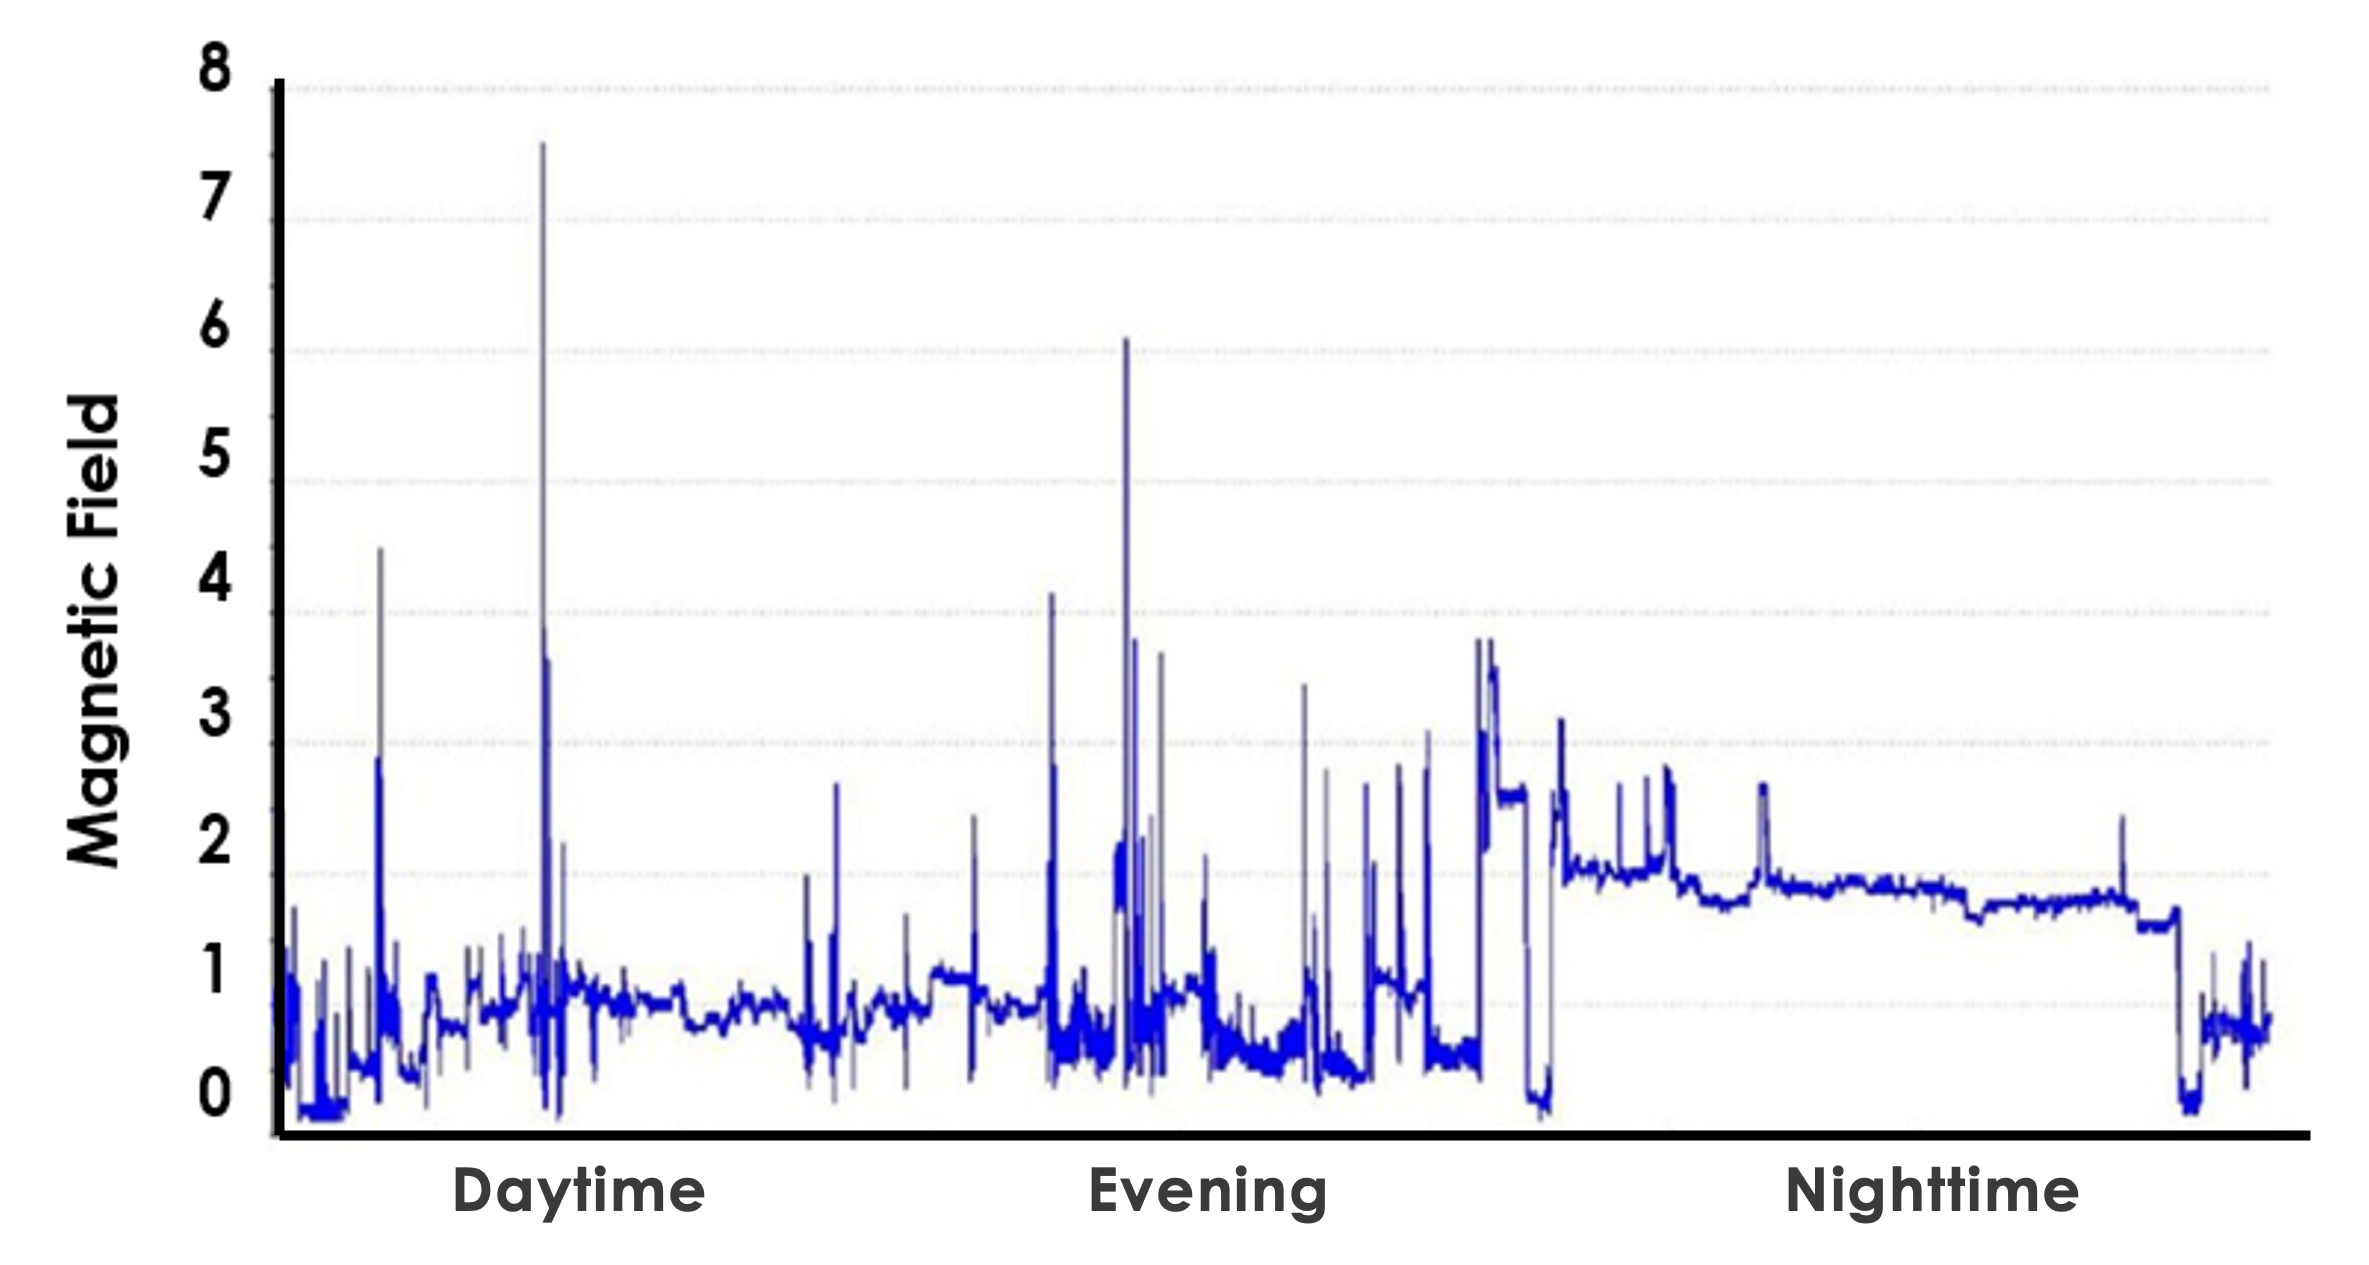
The level of magnetic field exposure a person receives depends on various factors including the location of their residence relative to nearby transmission and distribution lines; their behavior and activities within the residence as they may relate to local sources, such as appliances, electronic devices, and the wiring within the home associated with electrical service; and the field sources present in locations away from home (e.g., your workplace, stores frequented, or recreational facilities) all factored in to the amount of time spent in these locations. Thus, magnetic field exposure fluctuates constantly over time, with an example of an individual’s 24-hour exposure record shown in Figure 4 .
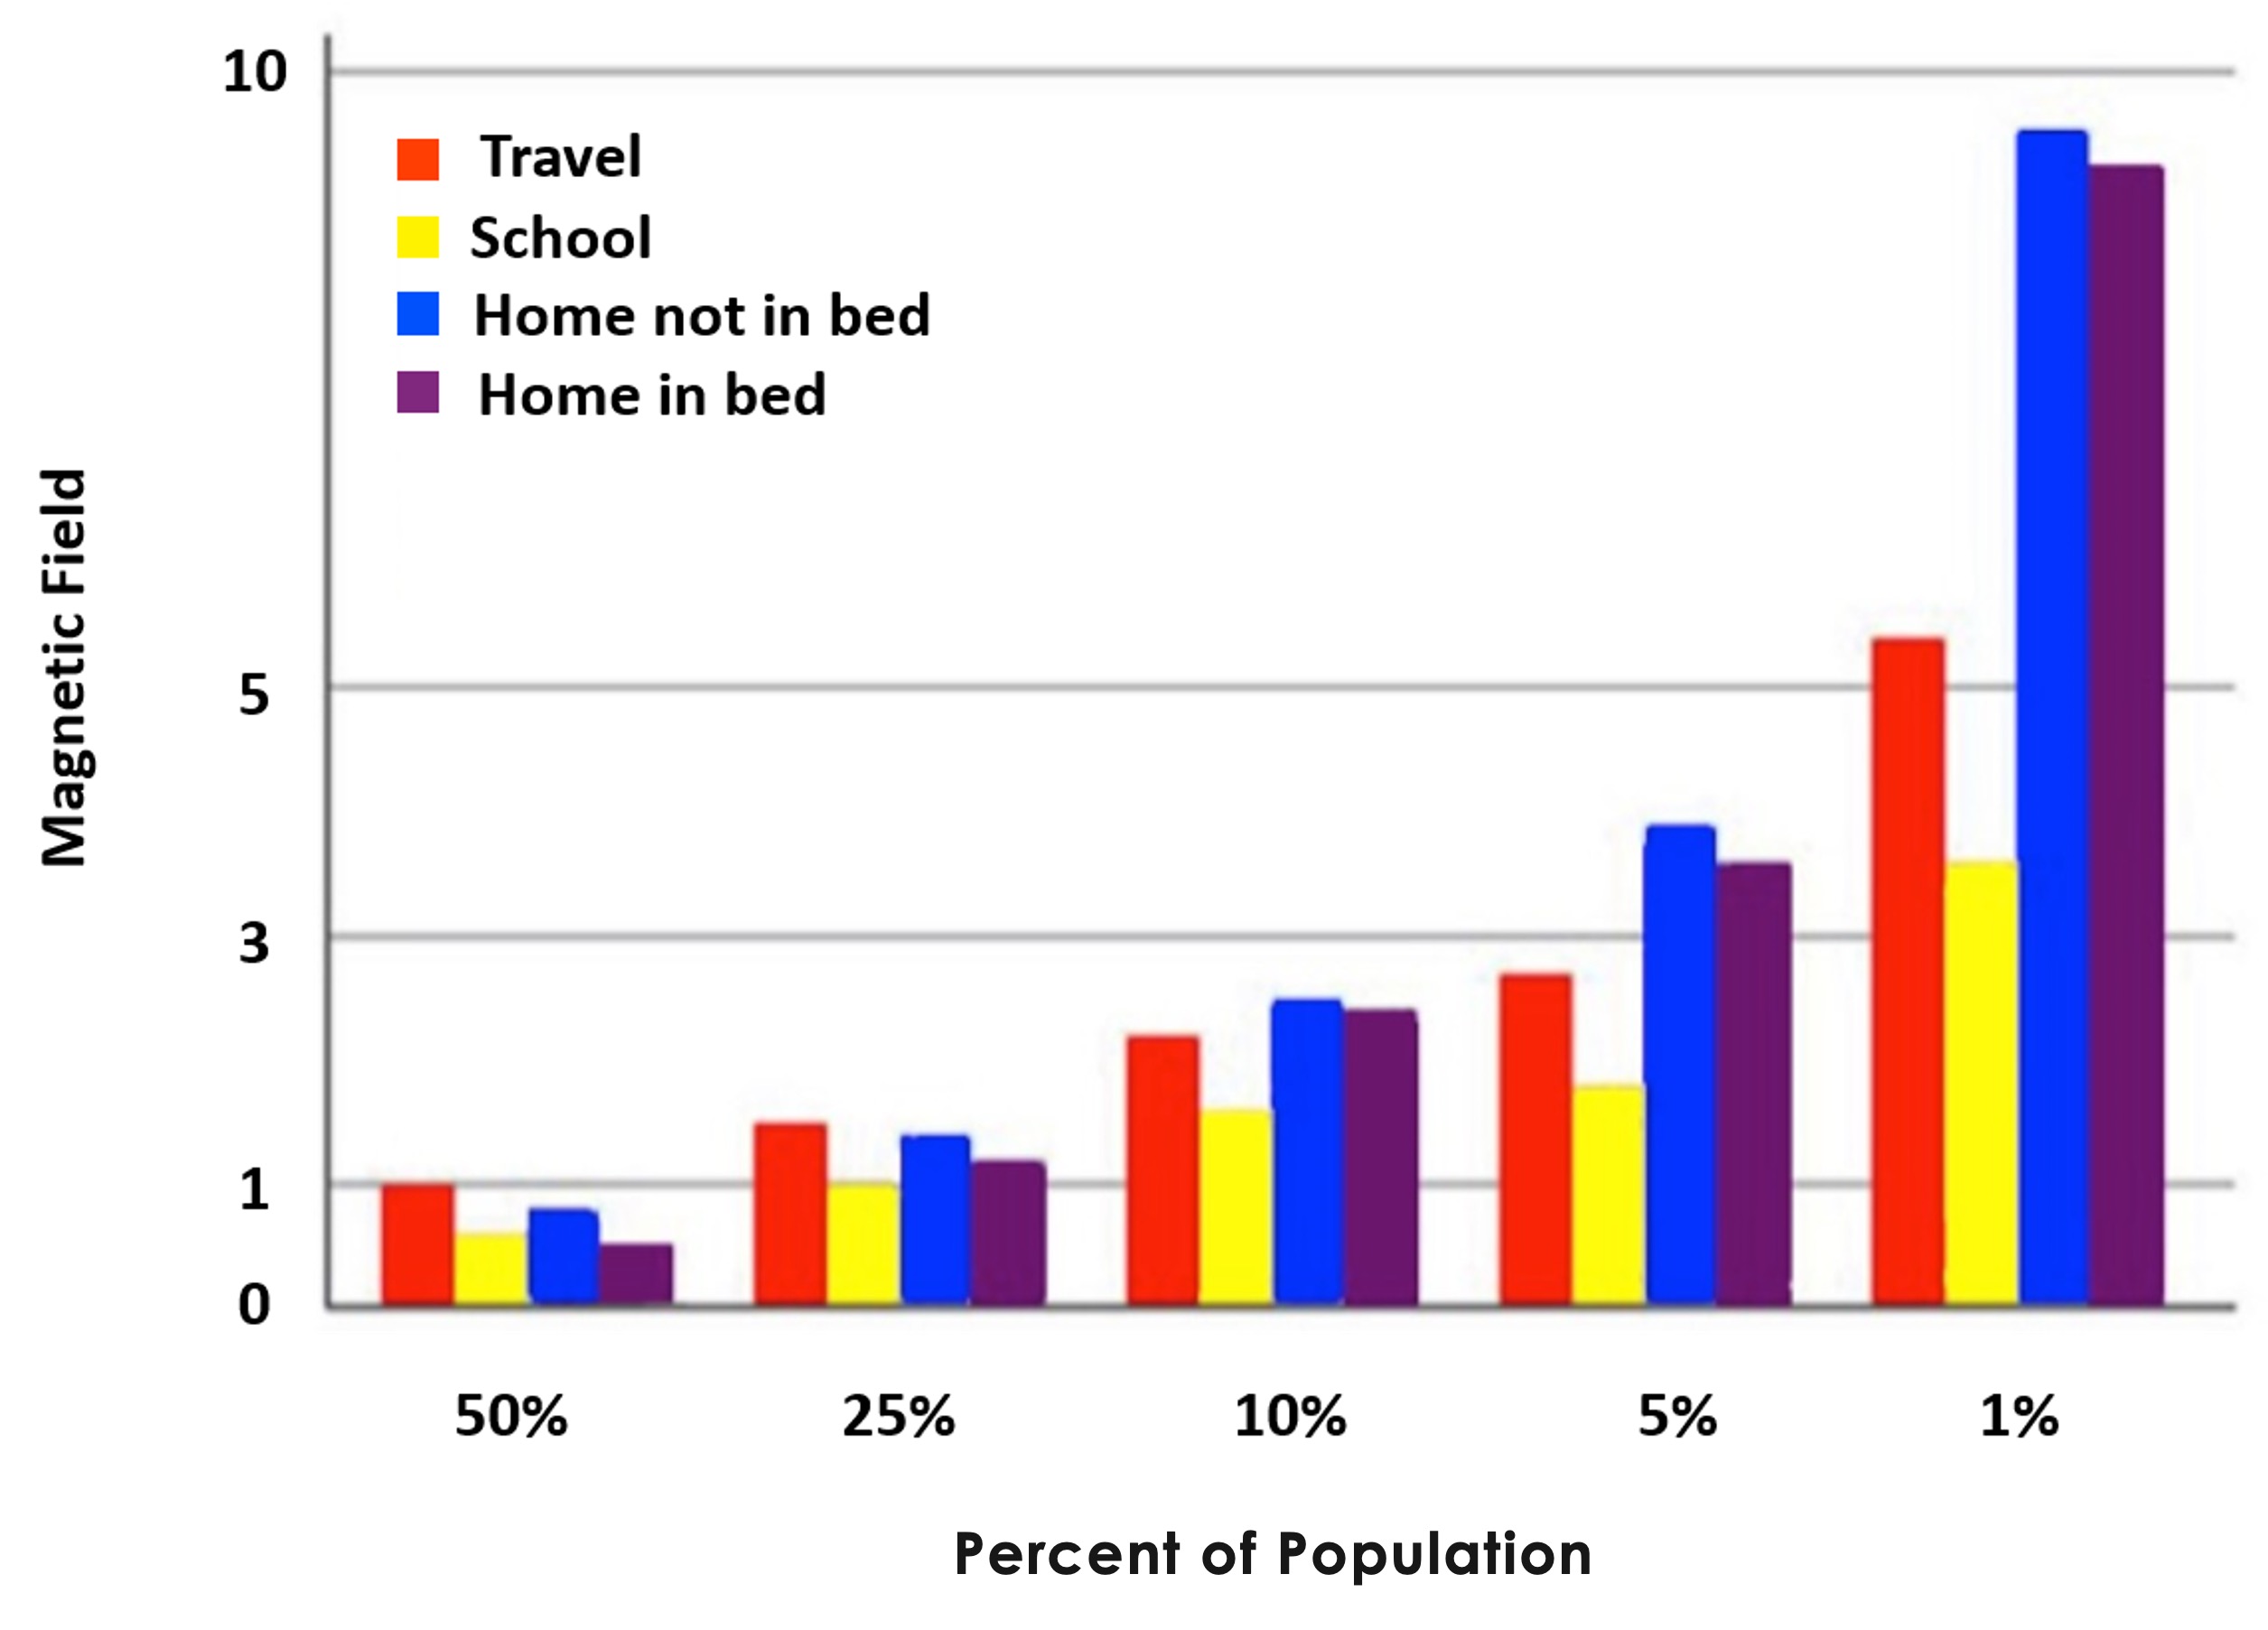
The ‘Thousand Person Study’, sponsored by the U.S. Department of Energy (DOE), was designed to capture personal exposures to magnetic fields representing the demographic cross-section of the U.S. For example, Figure 5 shows that the top 5% of people in the country were exposed to an average of at least 3 to 4 mG in the home, whether or not in bed, while the top 1% of the population experienced higher exposures (5 to 10 mG) while at home. The highest average exposures away from home (red and yellow bars) were generally lower than those at home. Though completed some time ago, the results are still considered representative of contemporary exposure patterns.